


Stocks for the Long Run: UK Edition
How have UK stocks performed over the last 200 years and how does this compare to the US?


It’s a truth universally acknowledged in the world of investing that stocks outperform bonds over long periods of time. In any given year, the return on the stock market, let alone an individual share, can be extremely volatile; but over time, ups outweigh downs, and the total return is better than could be achieved by holding a less volatile asset.
The ballpark annualised returns to expect? 6-8% for equities, 3-4% for bonds, giving an excess return of equities over bonds (aka the equity risk premium) of 2-4%. The implications of this? Investors with long time horizons, such as those saving for retirement, should heavily weight portfolios towards equities. The basis for these numbers? Heavy reliance on performance of the US equity and bond markets post-1929.
Evidence from the US
To be fair, these return estimates, which were presented as an industry rule of thumb when I was first learning about these things, were supported by data over a longer time horizon. In 1994, Jeremy Siegel first published Stocks for the Long Run, in which he pieced together US equity and bond data going back to 1802. In the latest edition he found that US stocks had delivered a real average annualised return (i.e. after inflation) of 7% since 1800, delivering a 3.4% average annualised premium over bonds. International evidence also supported the outperformance of stocks over bonds.
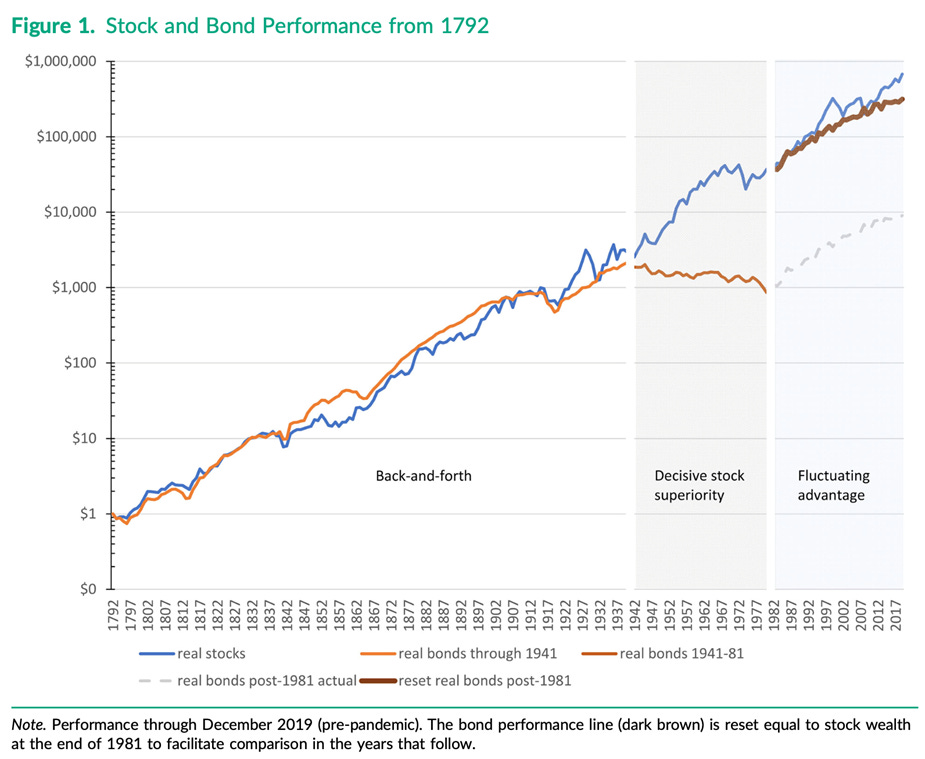
It was only earlier this year that I came across the idea that Stocks in the Long Run might not be quite as clear cut as thought, even in the US. By piecing together an array of sources, Edward McQuarrie expanded the data set used by Siegel for the 1800s and discovered that performance in that century was more mixed. Up until 1941, there was a back-and-forth between stock and bond performance; it was only after 1941 that stock outperformance was clear cut. And since 1982 it’s been what he terms a “fluctuating advantage” to stocks.1 McQuarrie’s view was that there was:
No consistent relationship between asset outperformance and length of holding period can be extracted from [Table 1]. The results are better interpreted as showing changes in regime. Prior to 1942, a regime of parity performance held sway: Sometimes stocks outperformed, sometimes bonds. After World War II, a new regime of extreme stock outperformance took hold.
As is normally the case with financial data and reporting, the headlines were all about the US – and McQuarrie’s work only shared the top line international findings. This got me wondering what the UK data looked like relative to the US – and while starting to work this out, I discovered a paper published last month, by people eminently more qualified than me. Hooray!
US vs UK long-run equity returns
With thanks then to Chambers et al., who reviewed a range of studies on long run asset returns, below is a comparison of UK and US stock and bond returns since 1800.2.
What can we take from the above?
First, stocks have delivered positive real returns in all three time periods – and over the full 223-year horizon, a real average annualised return of 6.6% in the US and 5.4% in the UK is pretty decent. However, the premium over bonds has fluctuated; in the US and the UK in the 1800s it was very small, and using McQuarrie’s data for the US only it was negative.
Second, 1900-1999 stands out for the level of nominal returns, at more than 10% in both countries, but real returns are not too different to the 1800s (prices fell during the 1800s whereas there was sustained inflation in the 1900s).
Third, US exceptionalism, in terms of equity market outperformance, is no new phenomenon. Except for bonds in the 1900s, US assets outperformed UK assets across all time periods. The levels might not look that different on an annual basis, but such is the power of compounding, over 100 years the difference in total return stacks up, as the chart below demonstrates (note that these returns are in local currency – in 1800, £1 was worth ~$4.44, whereas today’s it’s ~$1.28. A US investor in UK assets would have done much worse, whereas a UK investor in US assets would have done much better than the returns shown below).
Fourth and finally, UK equity market performance since 2000 has been absolutely dire, underperforming the US by 2.7% on average in real terms, significantly worse than the 200 years before. The obvious explanation for this is the extent to which value in the past two decades has been created in the technology sector, and how this has been dominated by US companies (partly via innovation, partly via aggressive acquisition strategies). It also surely reflects the wider malaise in the UK economy since the financial crisis.
What does it mean today?
Looking back over 200 years is all very well but what does it mean today? I think there’s three big questions to takeaway from the above.
If stocks barely outperformed bonds in the 1800s in both the UK and US, why invest in stocks? While certainly no guarantee that stocks will outperform, 200+ years of history seems to say that the worst case is somewhat equivalent performance to bonds, while the best case is big outperformance. So, you have limited downside from investing in stocks in the long run, but a lot of upside (it should be noted that returns over 20 to 30 years are far more volatile, and I’ll explore that in a future post). There is also the wider point about having different asset classes to benefit from diversification across a portfolio.
If McQuarrie is right and stock outperformance depends on “the regime” in place, how do I know which regime we’re in today? The unfortunate answer is you probably don’t. There are so many variables at play that could determine “the regime”, including the macroeconomic climate and the structure of the investment industry. Often changes are gradual and only in retrospect does it become clear there has been a large structural shift. Rather than trying to predict regimes it may be better to simply accept that sometimes bonds outperform, sometimes stocks do, and maintain diversification across both.
If US stocks outperform UK stocks over the long run, why invest in the UK at all? Historically there was an easy answer to this as it was either extremely difficult to invest overseas (because of capital controls), or very costly to do so. But today that doesn’t hold – it can be cheaper to buy US shares than UK ones because of the stamp duty on the latter. Another argument might be because you expect long-term appreciation in the pound relative to the dollar, or because you expect some cataclysmic event, such as a devastating war, to affect the US more than the UK. Right now, both seem tough arguments to make. Instead, I think the reason for investing in the UK is because long run return numbers are just that. Returns fluctuate a lot over shorter time frames, and right now the UK looks relatively cheap while the US looks relatively expensive. That supports maintaining some diversification across both markets.
You can go deeply into the weeds on any of these above, but what really emerges is another universal truth of investing, which is the value of holding a diversified portfolio. Whether that’s across equities and bonds, or domestic and international securities, we should be humble in our ability to know what asset classes will outperform, even over the very long term.
Looking ahead…
I’ll be taking a break over Christmas and New Year, although I plan to continue with regular updates to the FTSE 250 A to Z. I’m really enjoying writing this Substack and thank you all for continuing to read it! In future posts I plan to look more at UK equity returns over shorter time periods, including comparing them to the nation’s favourite investment, housing.
McQuarrie (2023) ‘Stocks for the Long Run? Sometimes Yes, Sometimes No’, Financial Analysts Journal.
did a good three-part series on McQuarrie’s findings, although it’s worth reading the underlying paper because unlike 99% of finance articles it is actually readable.
Thank you for this. Very interesting. I look forward to the continued ftse 250 analysis. My portfolio is biased US wise and you are correct in perhaps there are some UK gens undervalued. Depends on how our latest bunch of clowns in charge release their potential 😂